Data Quality Assessment
Uploading and Setting Up Your Data
Once the dashboard application has been launched in your web browser, select your data file. HeartView will accept raw European Data Formatted (.edf) files from the Actiwave Cardio, archive (.zip) files from the Empatica E4, and comma-separated values (.csv) files from other ECG and PPG sources.
In the example below, a CSV file containing raw data from another ECG source is uploaded to the dashboard.
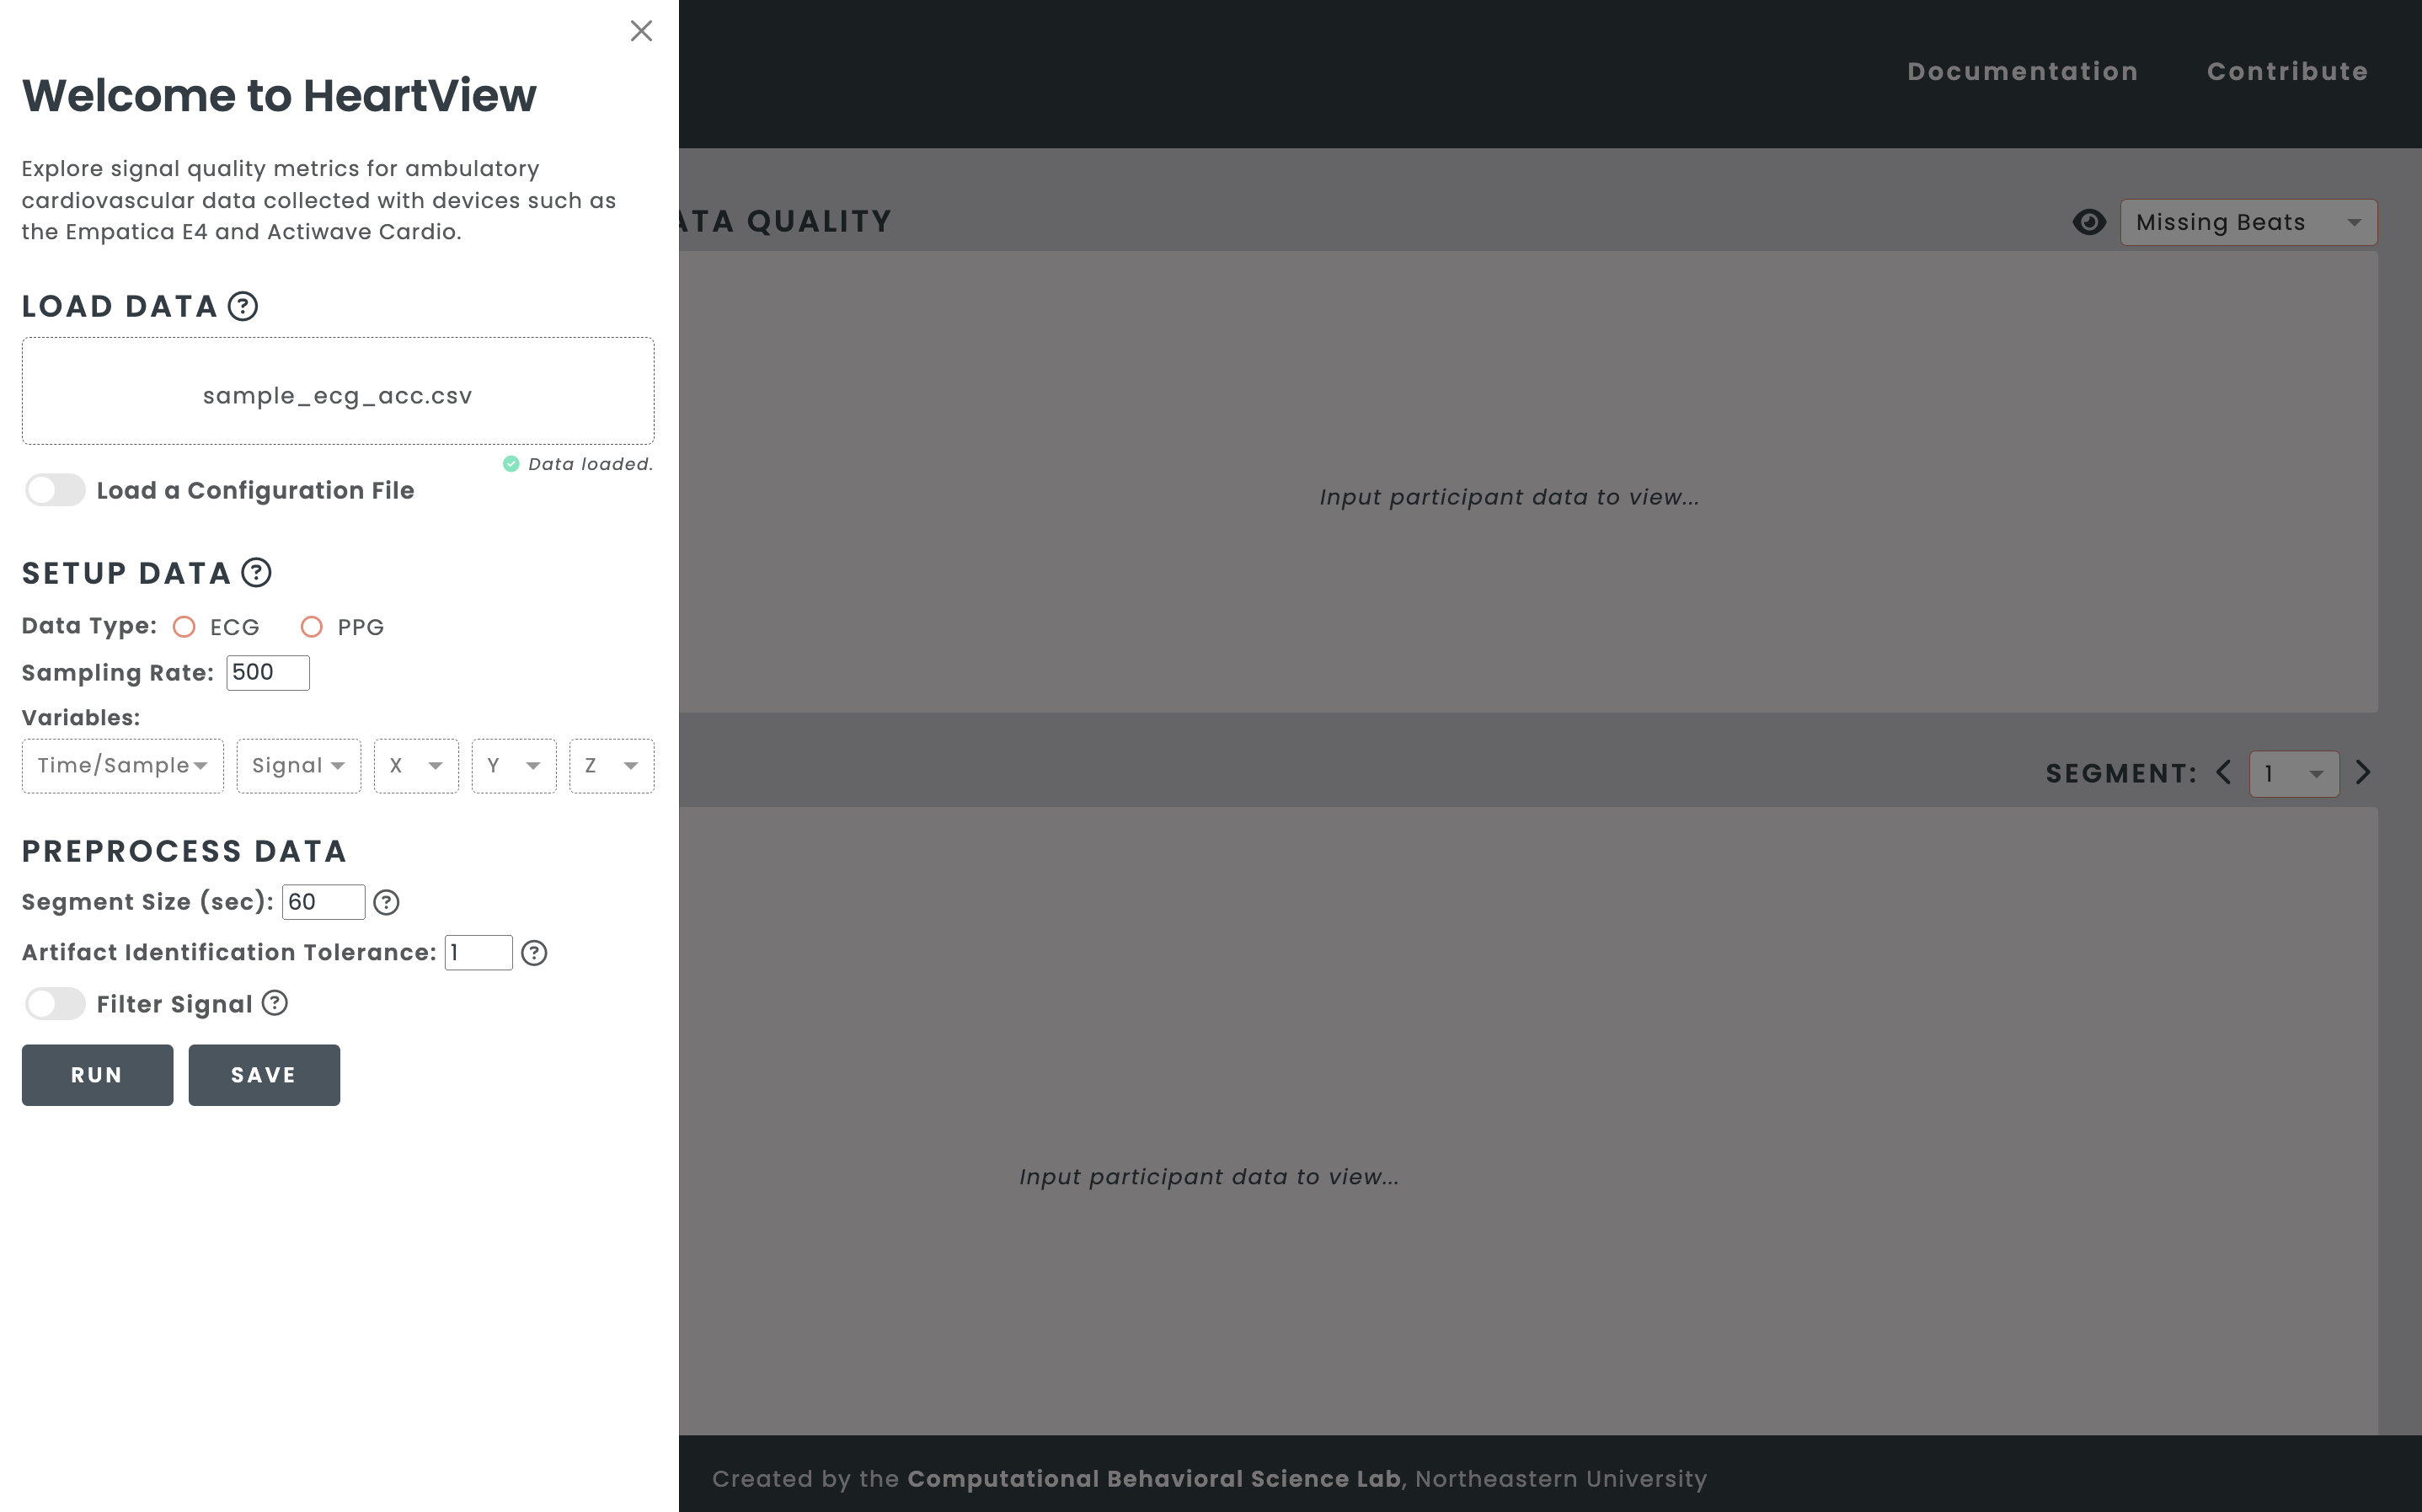
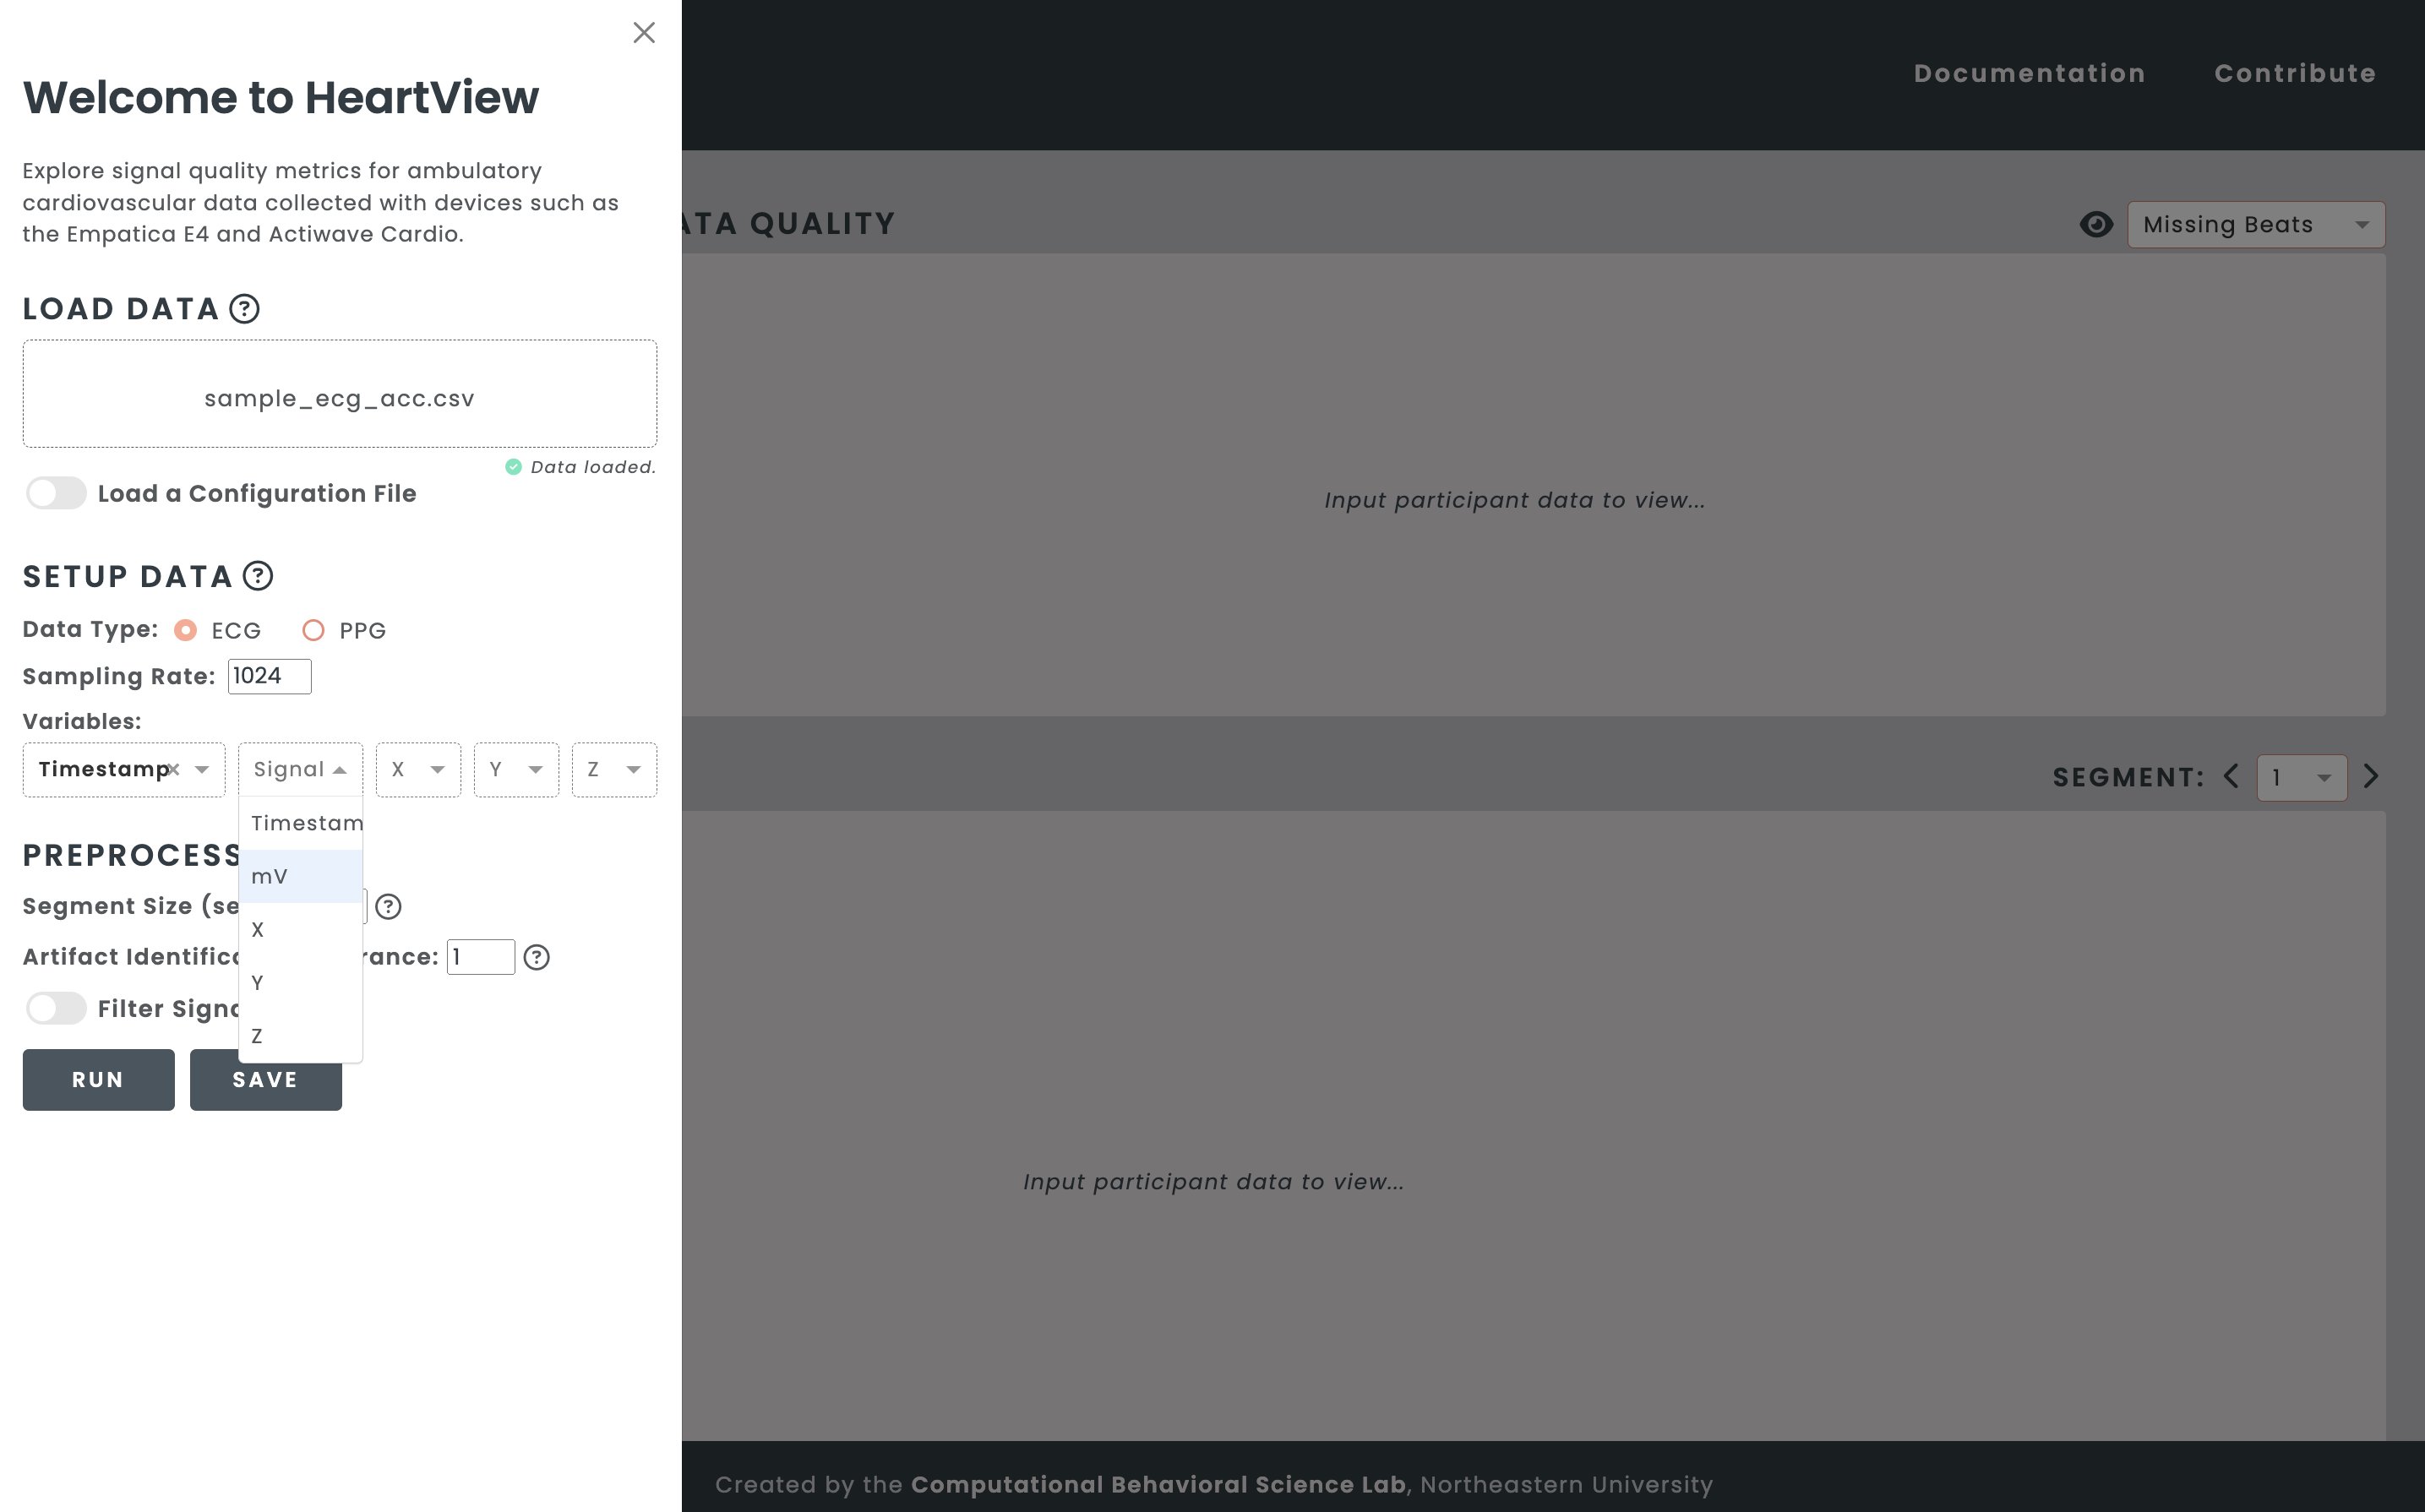
Set the data type and the sampling rate, and map the headers in your CSV
file to their respective timestamp and ECG variables.
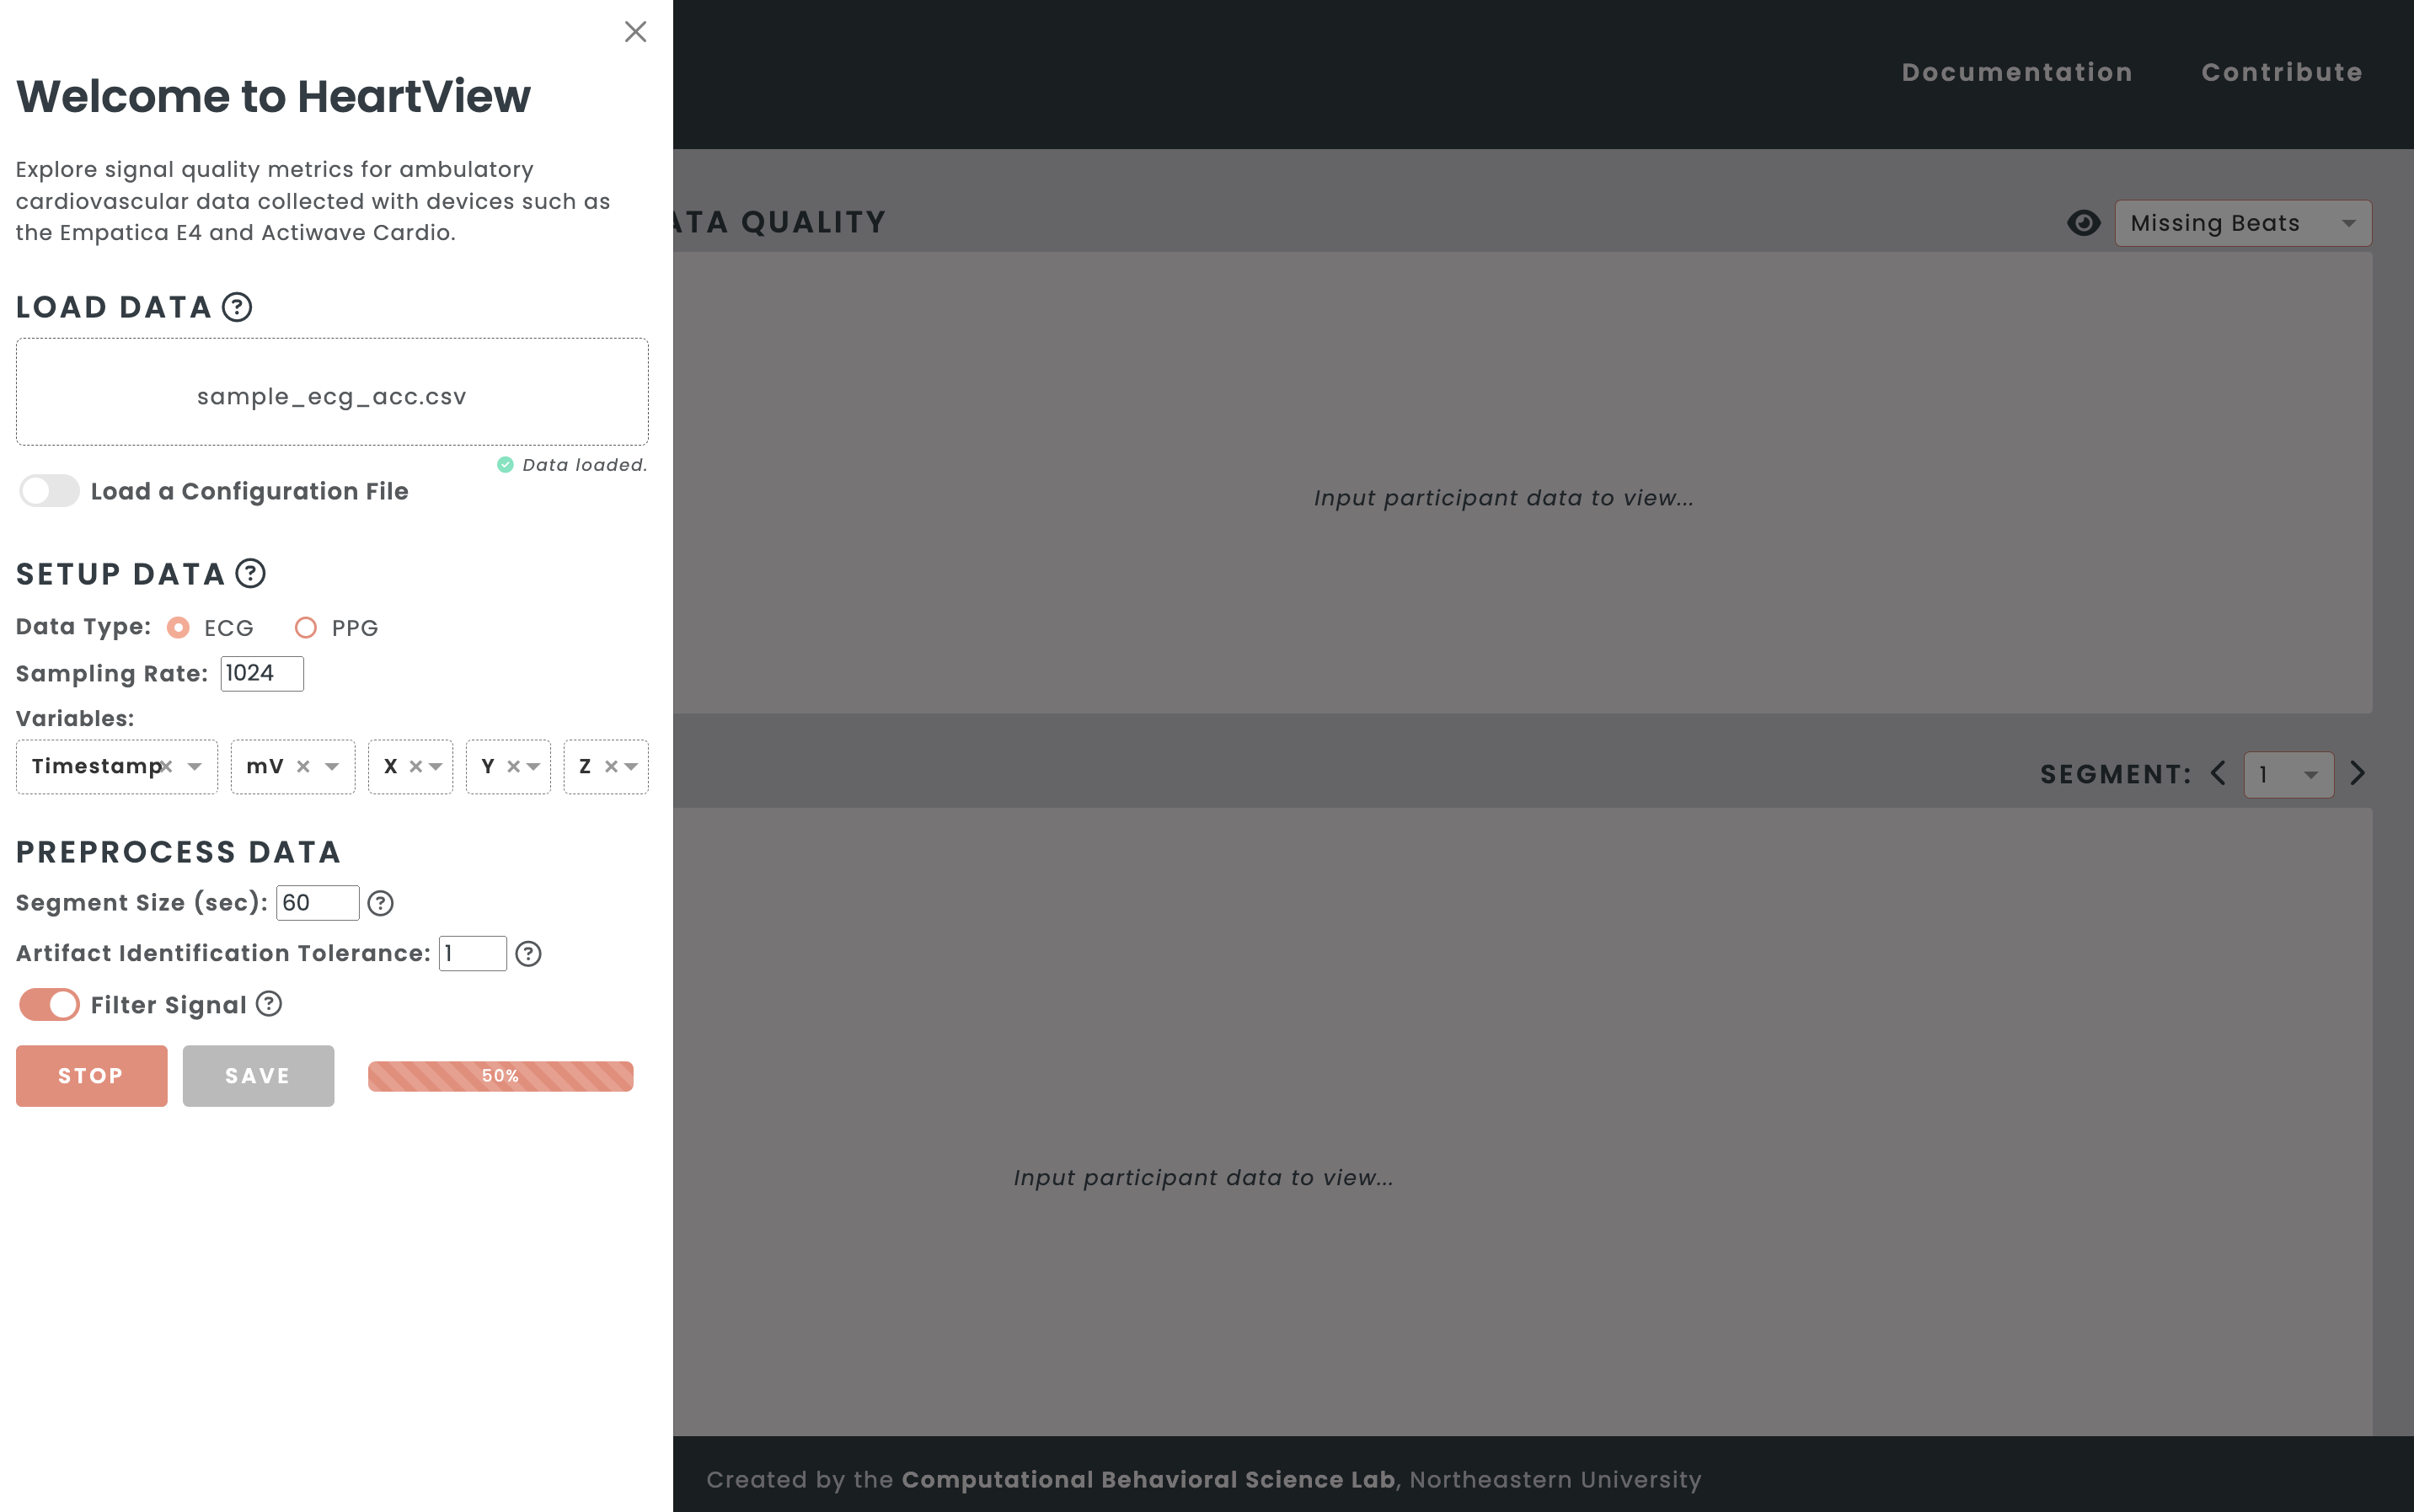
Set the window size (60 seconds, by default), artifact identification
tolerance (any floating-point value between 0 and 2), and select whether to
apply filters to your data. Click the “Run” button to run the pipeline.
Viewing Signal Quality Metrics
HeartView’s main dashboard shows three panels.
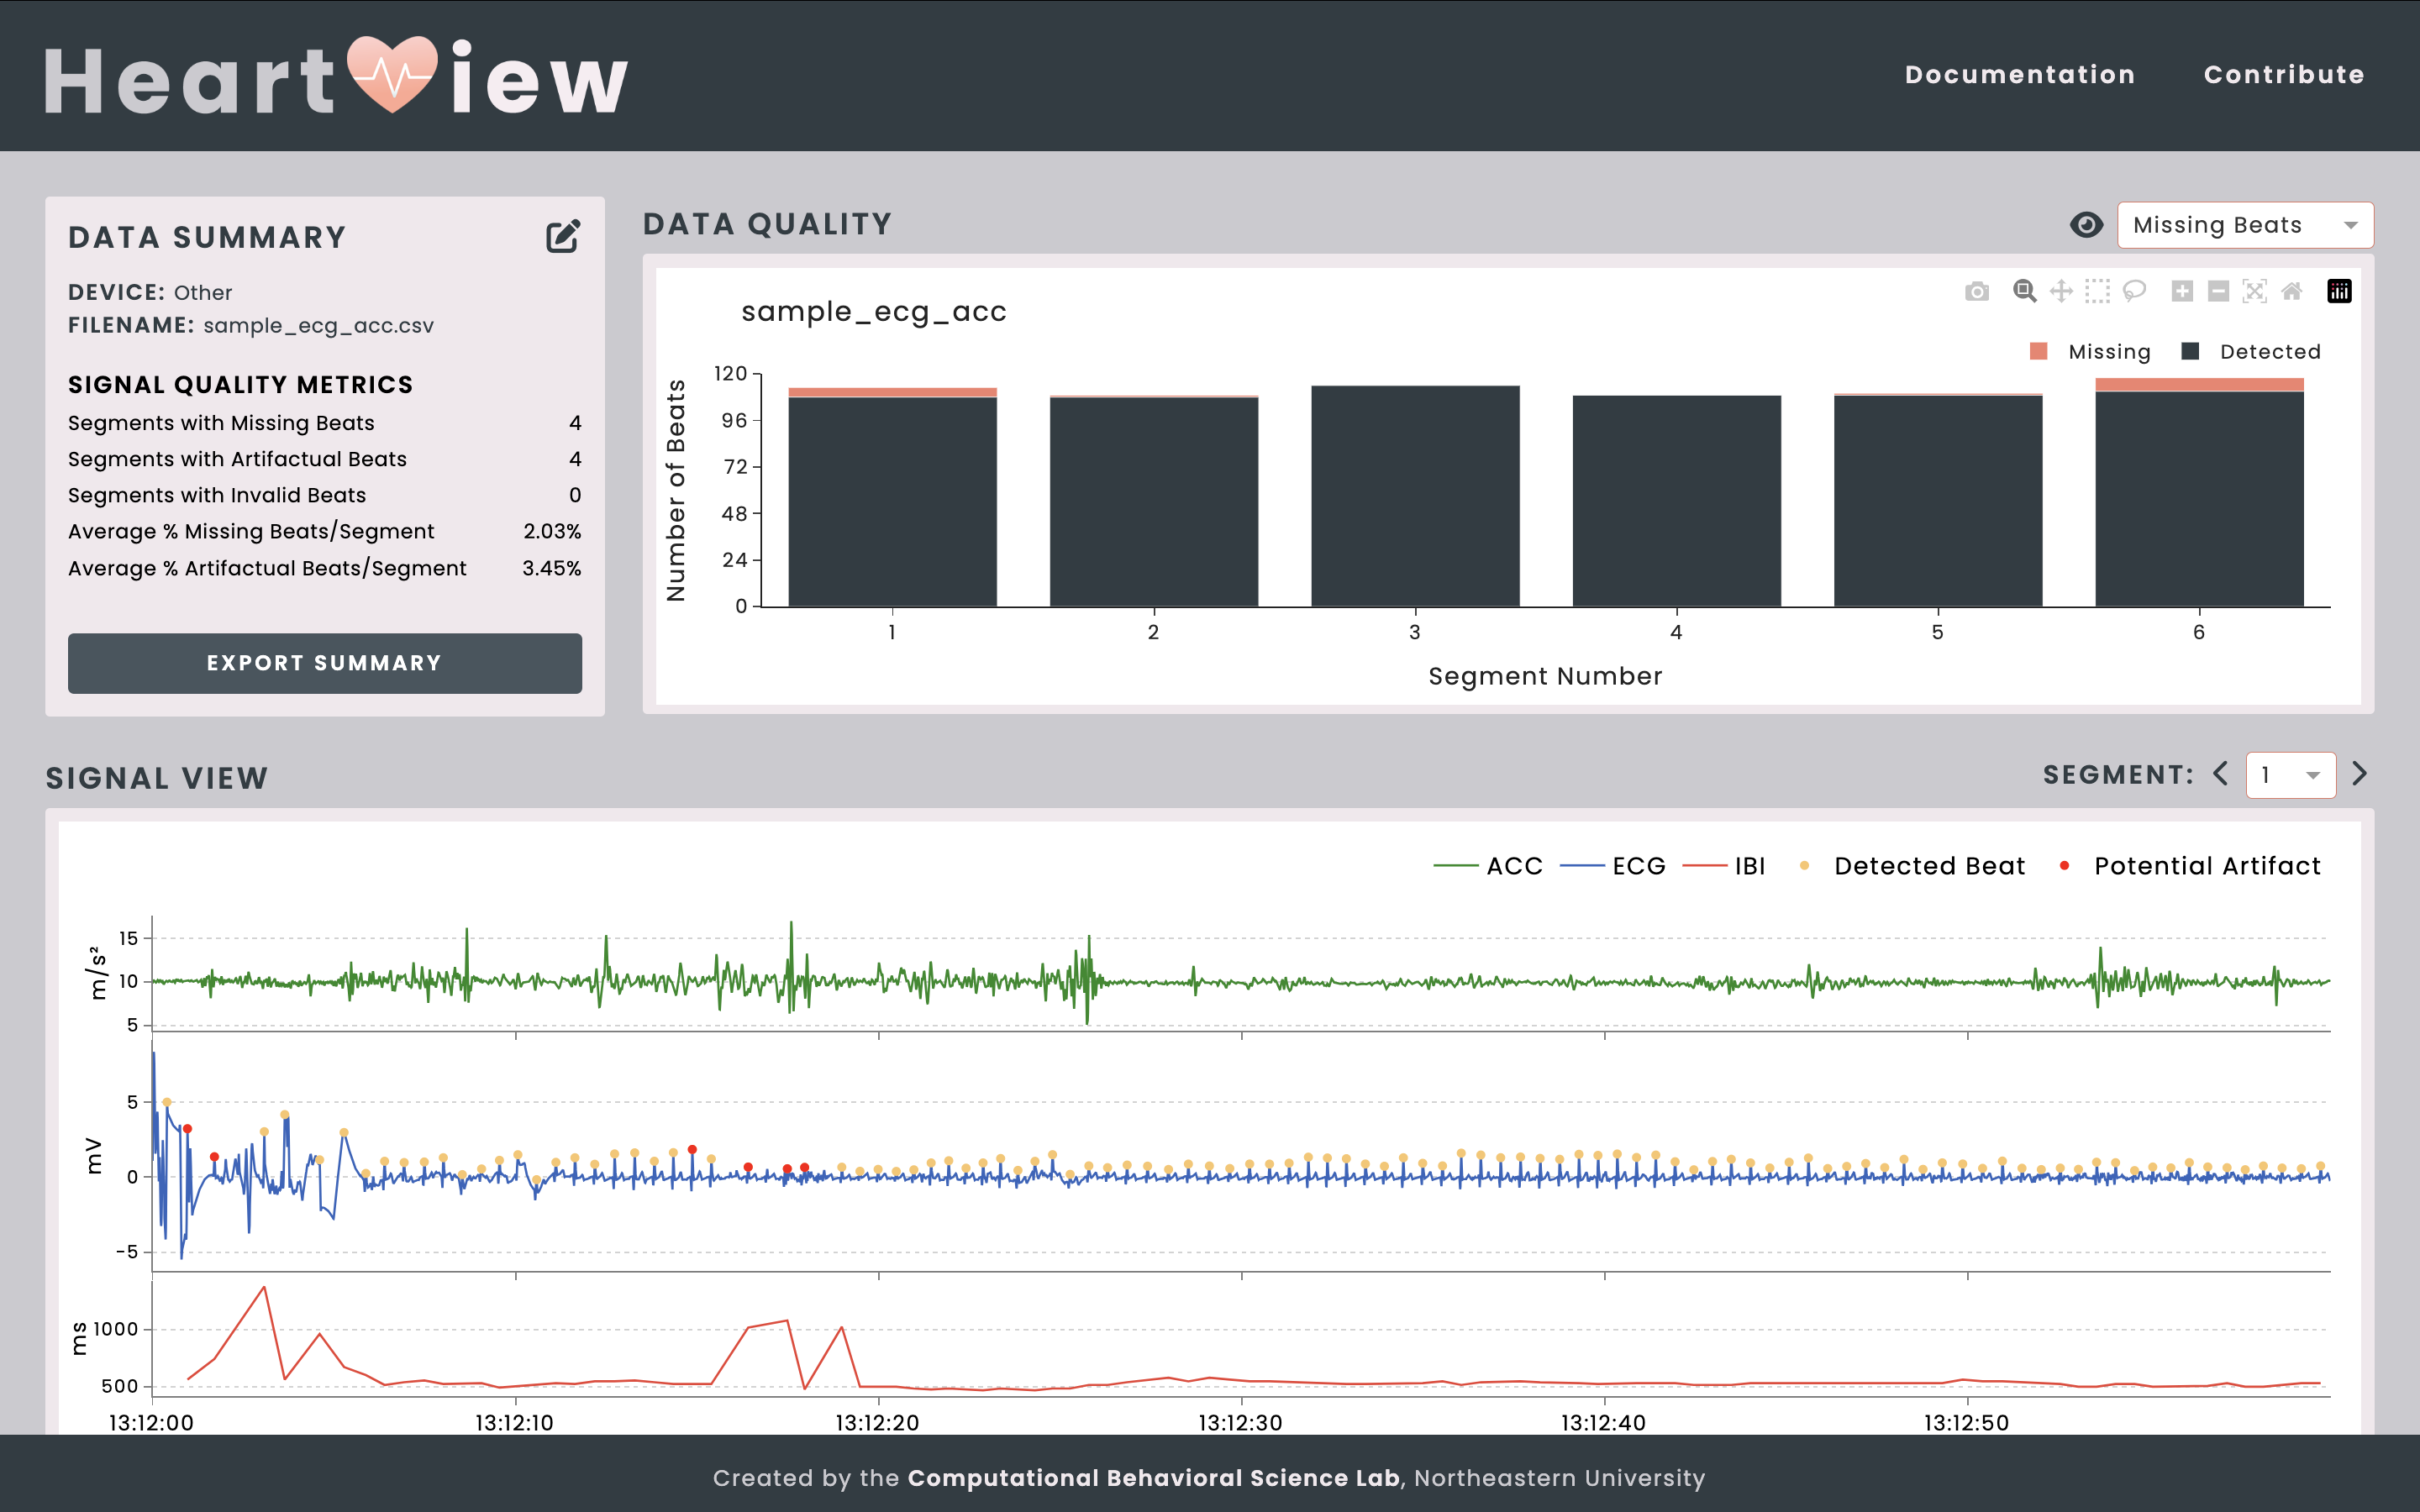
Data Summary displays information about the loaded data file
and signal quality metrics, including the number and proportion of invalid
segments, as well as segment-by-segment counts and proportions of missing
and artifactual beats.
Data Quality shows interactive bar charts of numbers of
artifactual and missing beats against the number of detected beats and
whether they are invalid per segment.
Signal View shows the ECG/PPG, interbeat interval (IBI),
and, if given, acceleration signals pre-processed from the data file.
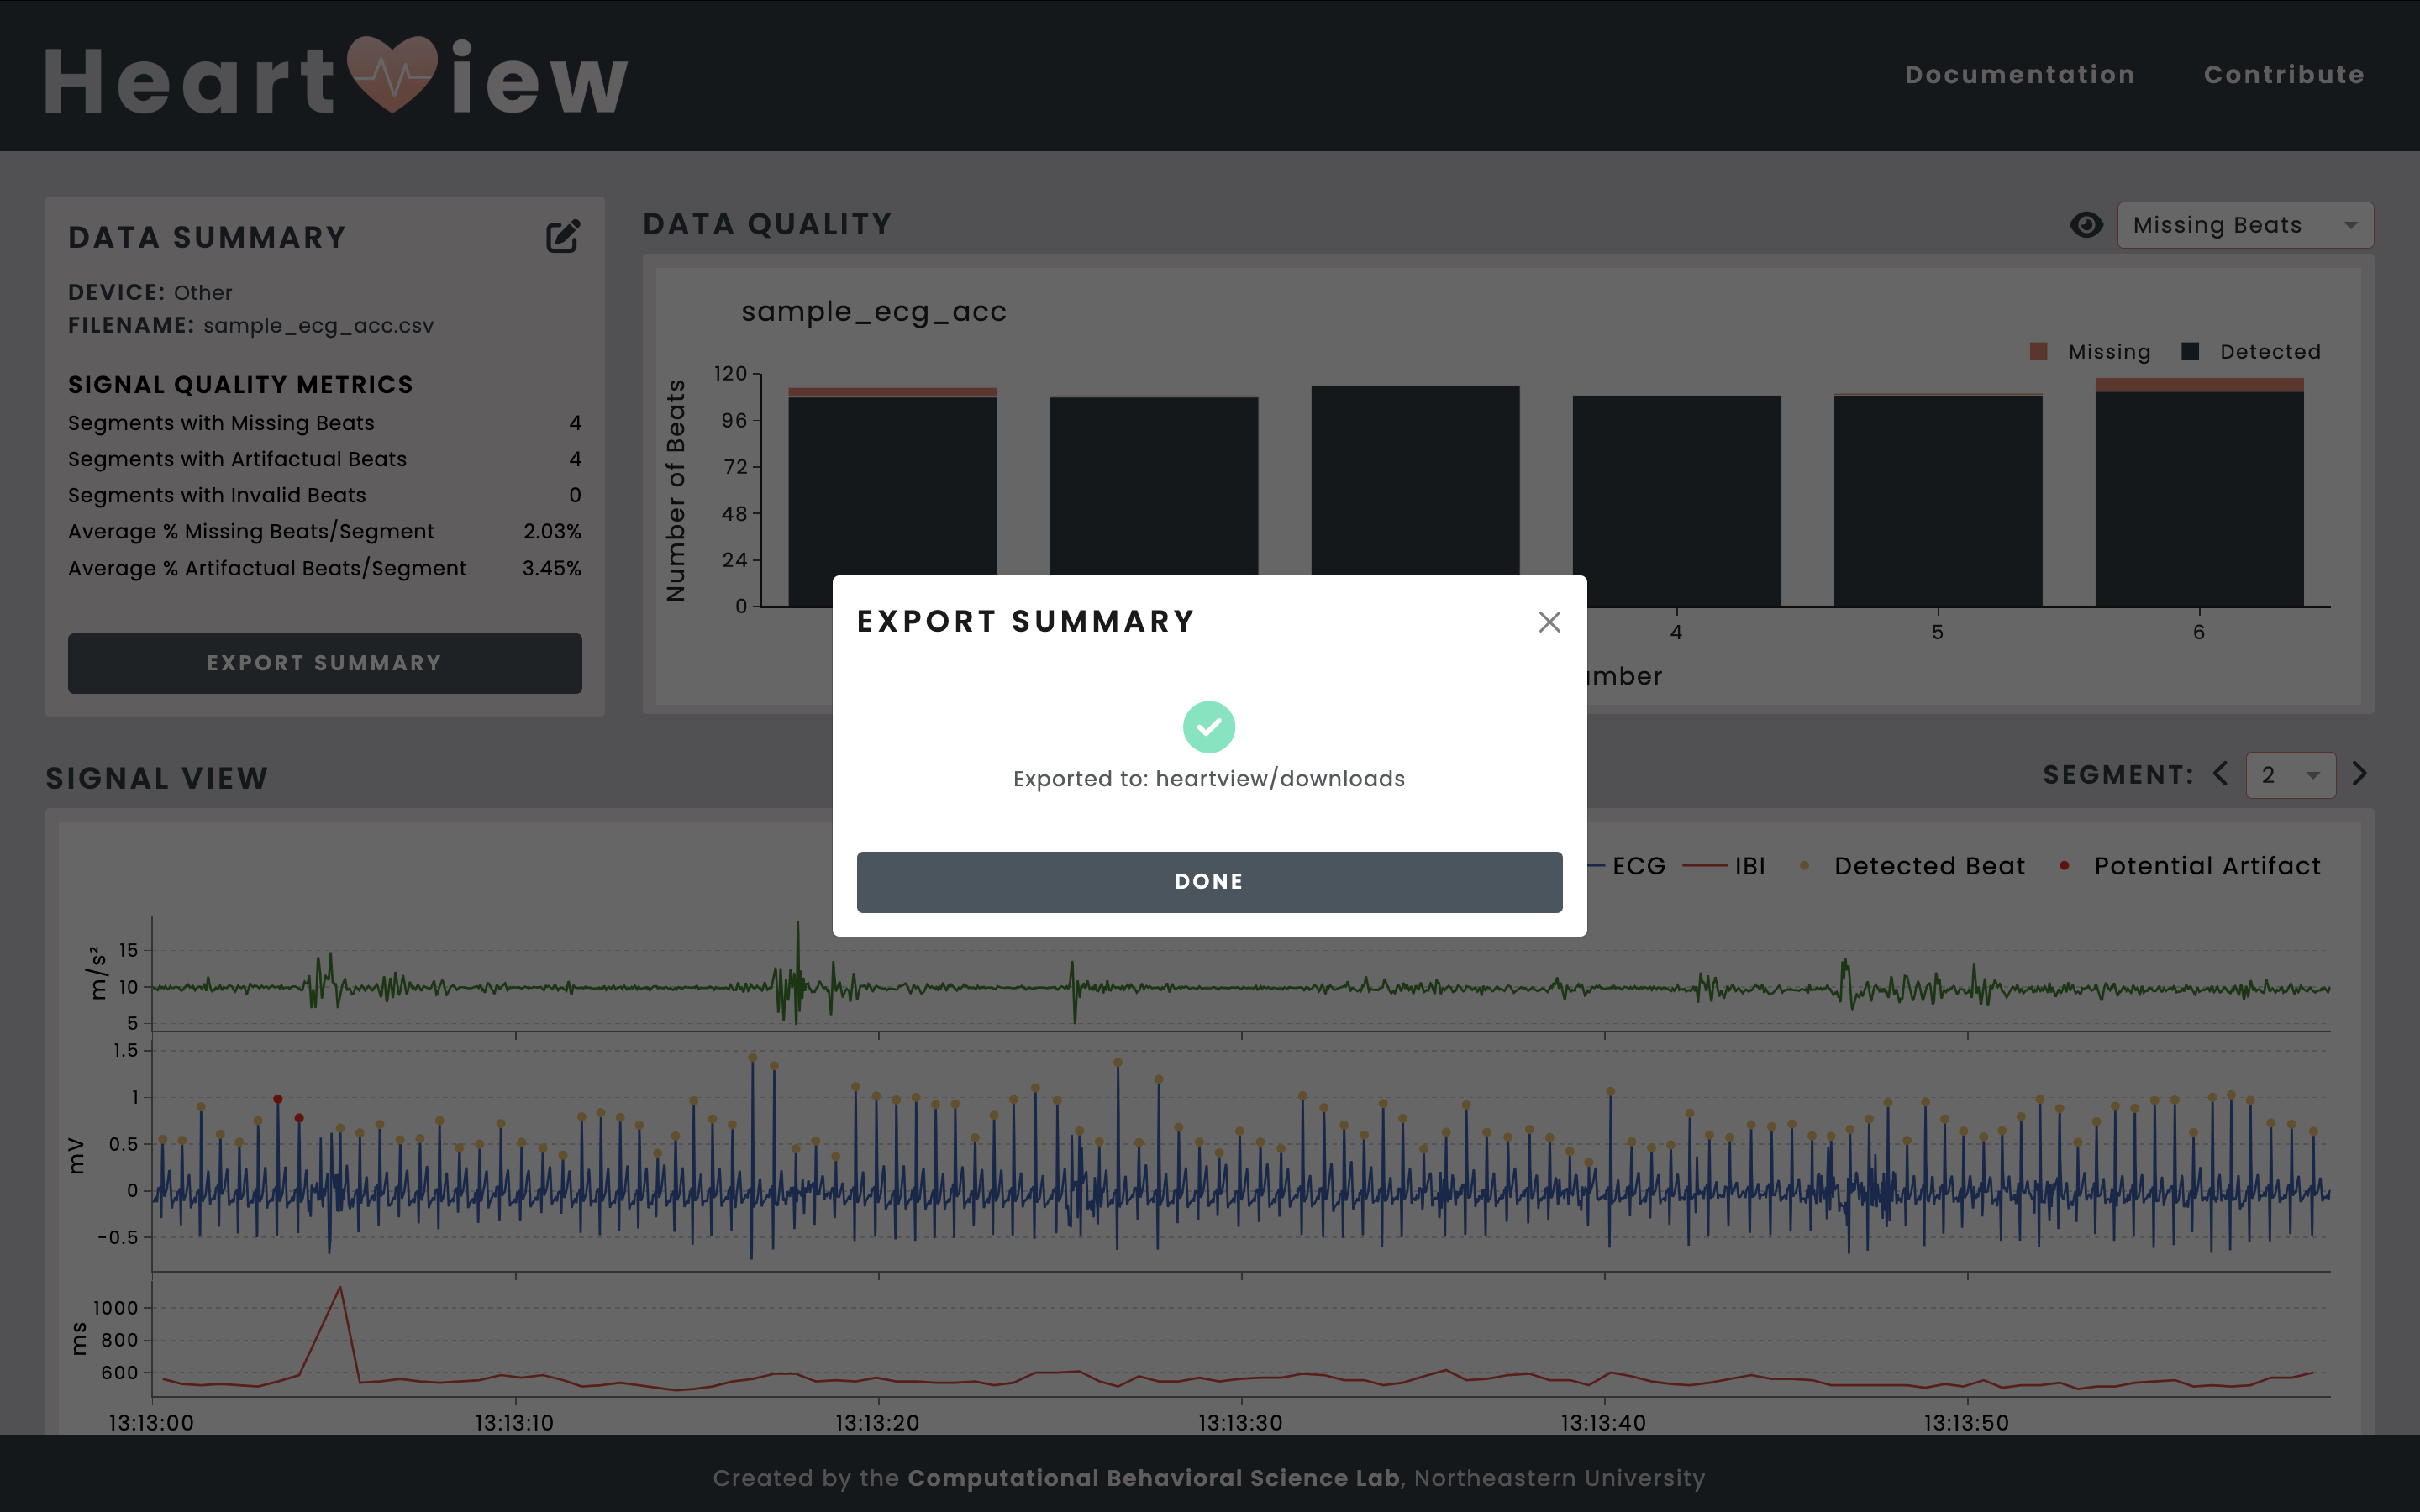
Exporting the Data Summary
The Export Summary button in the Data Summary panel allows you to download your data summary as a Zip archive file or an Excel workbook.
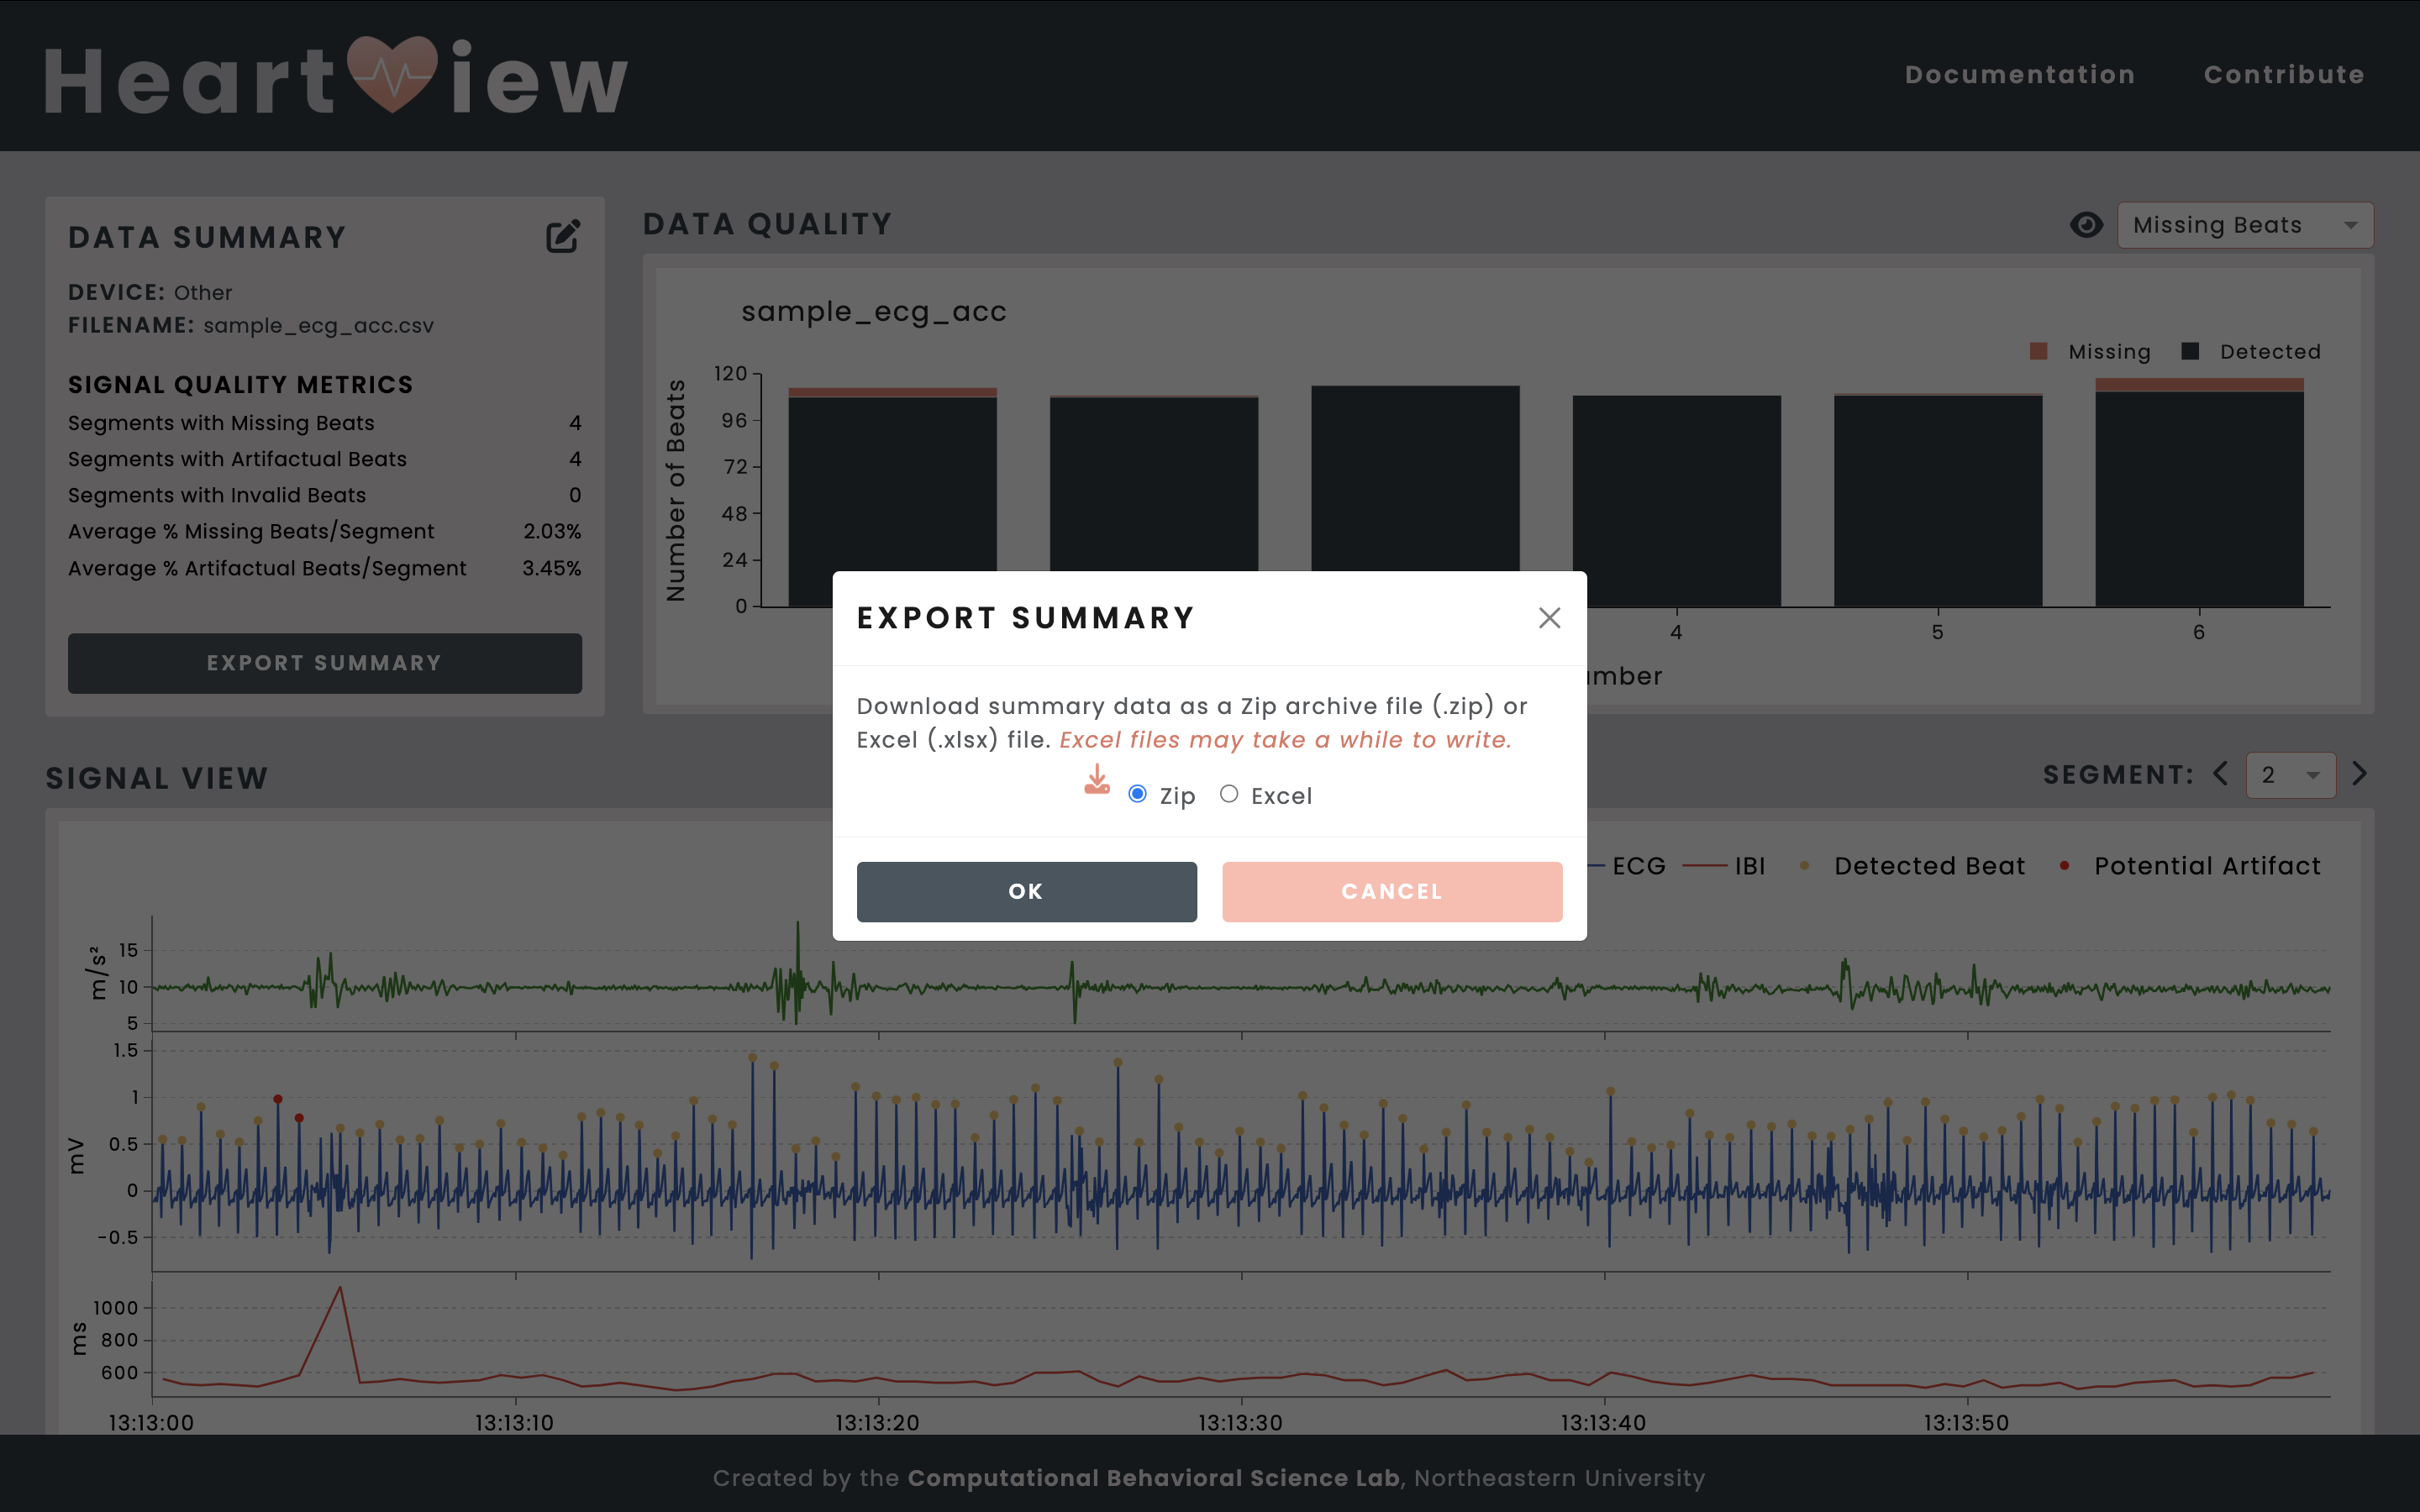
The resulting file is saved in the downloads/ folder in your HeartView project directory.
Download an example Excel workbook with the SQA summary here.